Commerce Portal - Dashboard
Introduction and General Information
The Commerce Portal Dashboard is designed to provide an overview of selected merchant KPIs. For this purposes, there is a variety of "dashboard widgets", which retrieve and calculate KPIs based on the merchant's data within the Commerce Platform. For most of the widgets, checkout and customer data is displayed in order to provide key business insights and to emphasize shopper purchasing behavior. For the widgets, the accuracy of the KPIs relies mostly on the provided merchant data. Because of this, there might be inaccuracies if data is not provided entirely or inconsistently.
Important Remark
Unless explicitly stated, the key figures refer to all sales channels.
Checkout Overview
The Checkout Overview is separated into two widgets that are designed in such a way to explicitly imply the merchant if action is required or not. The implication if action is required or not is based on the respective amount that are connected to the checkouts.
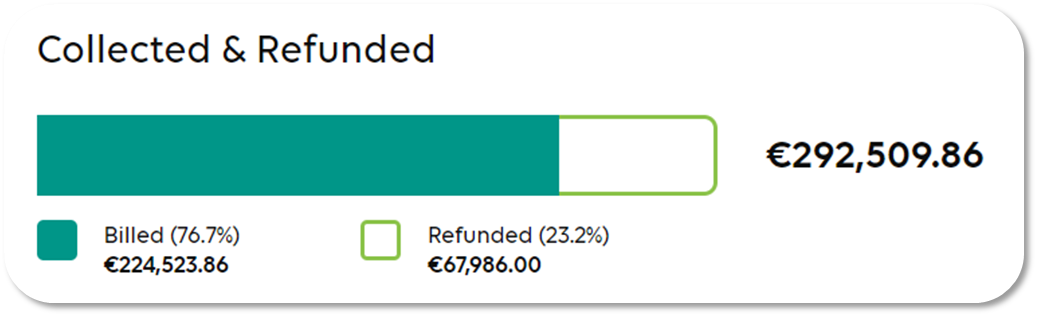
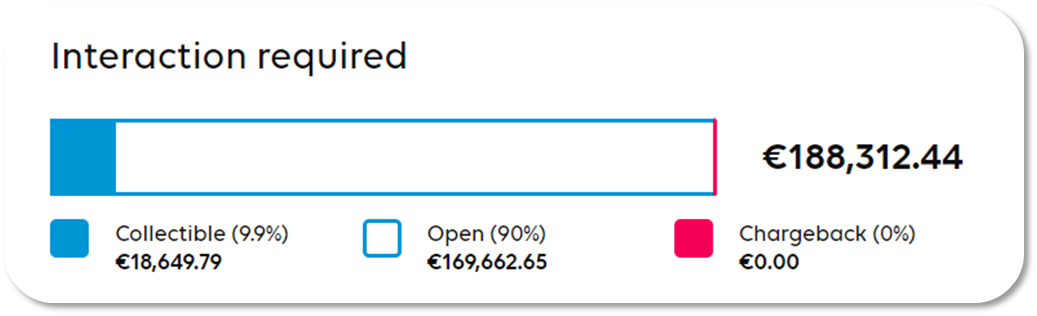
Important Remark
The separation between those amounts and the implied actions are only recommendations and - depending on the merchant's business - might not be accurate or applicable.
Checkouts Number and Status
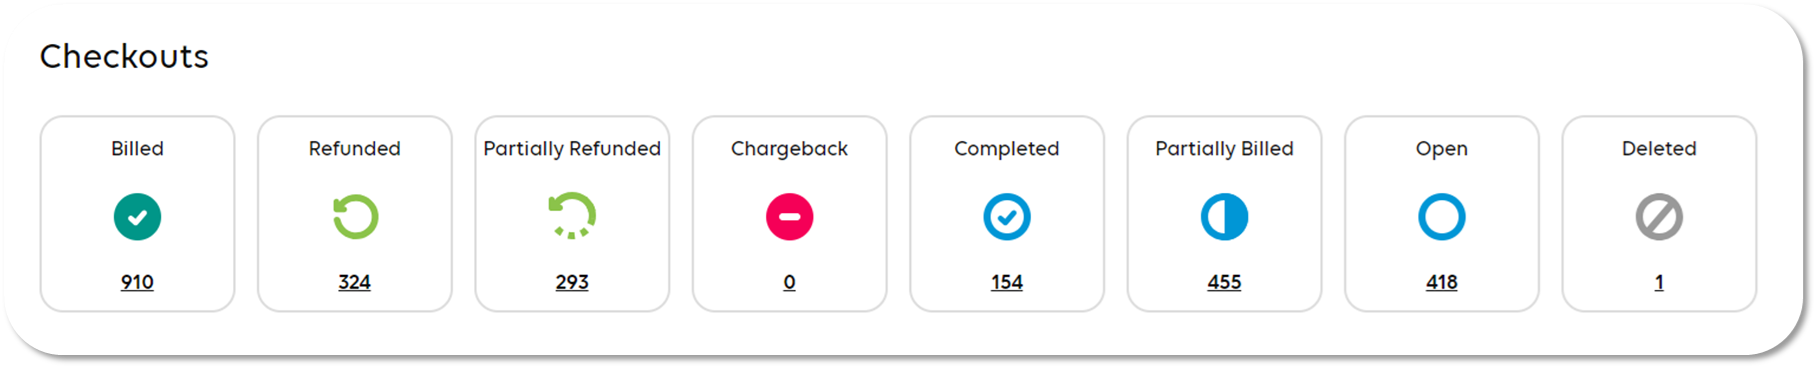
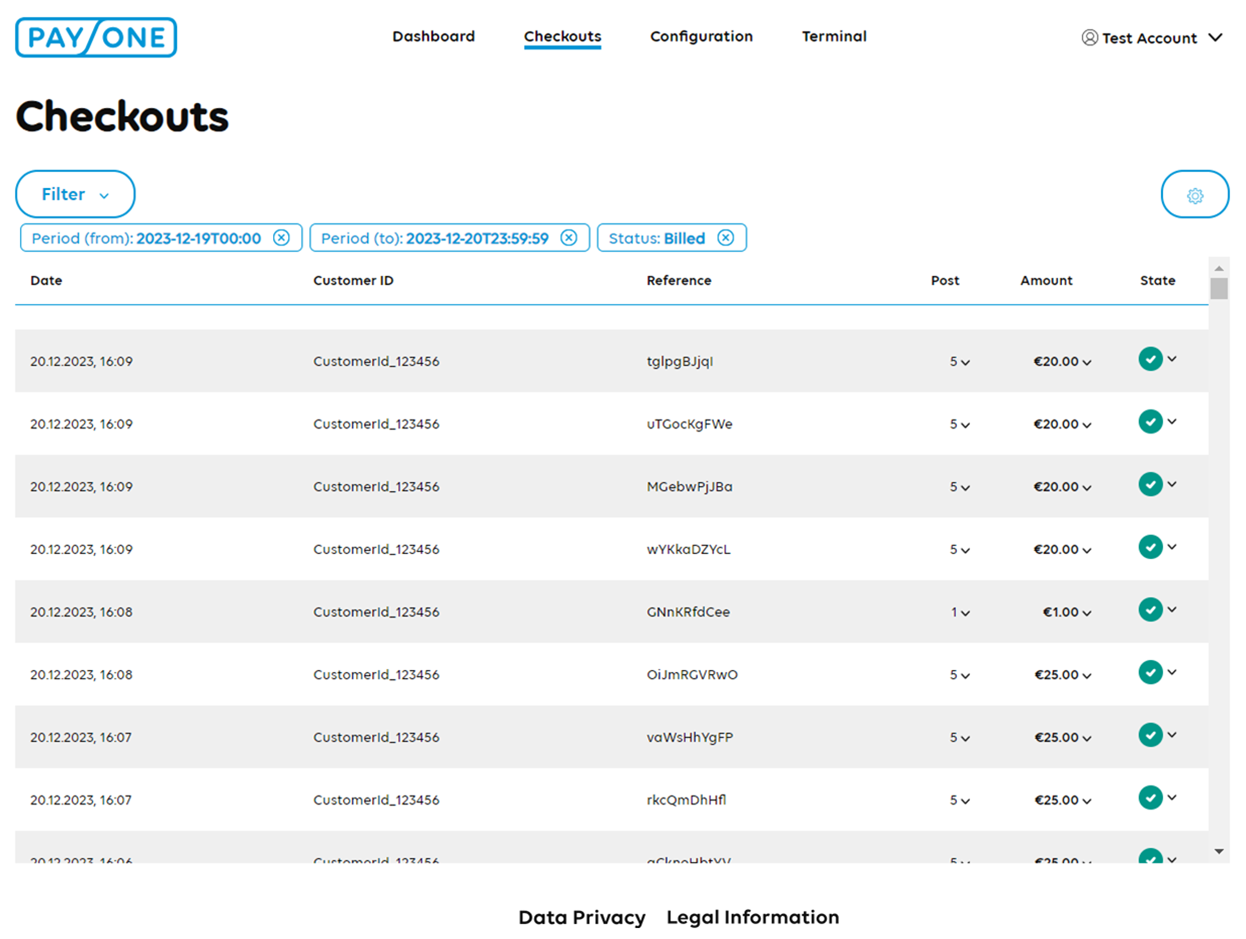
The "Checkouts" dashboard widget provides an overview of the total number of checkouts for the selected time period for the respective status. The number of checkouts for the respective status is actually a button: the filter settings for the time period and selected checkout status are automatically applied and displayed in the Checkouts tab.
Example for the checkout status BILLED:
Checkout Volume
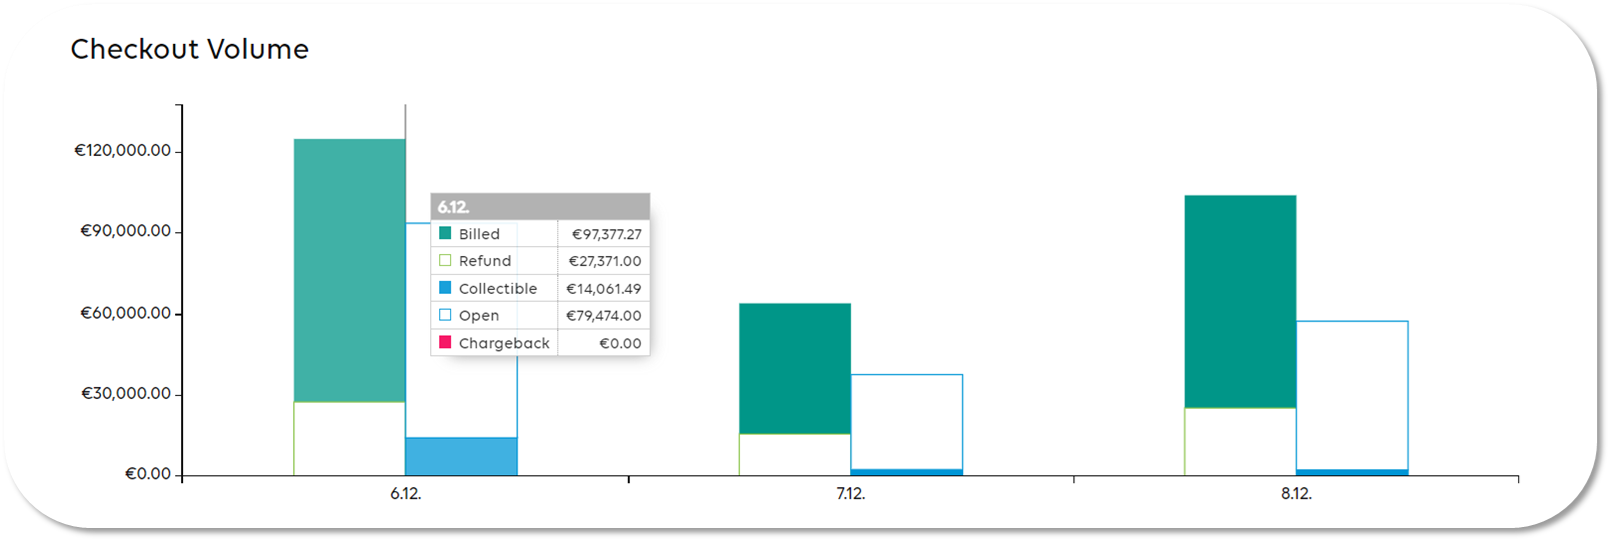
The "Checkout Volume" dashboard widget provides an overview of all aggregated amounts for all checkouts for the selected period . The data is clustered in the same way and uses the same colors the other two widgets "Collected and Refunded" and "Interaction Required".
Depending on the selected time period, the visual timeline changes:
|
Days |
Unit |
Format |
Example |
|---|---|---|---|
|
1 – 30 |
Day |
dd.mm. |
02.10. |
|
31 – 210 |
Calendar Week |
CW w |
CW 40 |
|
211 – 999 |
Month |
mm/yyyy |
10/2023 |
|
1000 – 2499 |
Quarter |
Qq/yyyy |
Q4/2023 |
|
2500+ |
Year |
yyyy |
2023 |
Checkouts Number
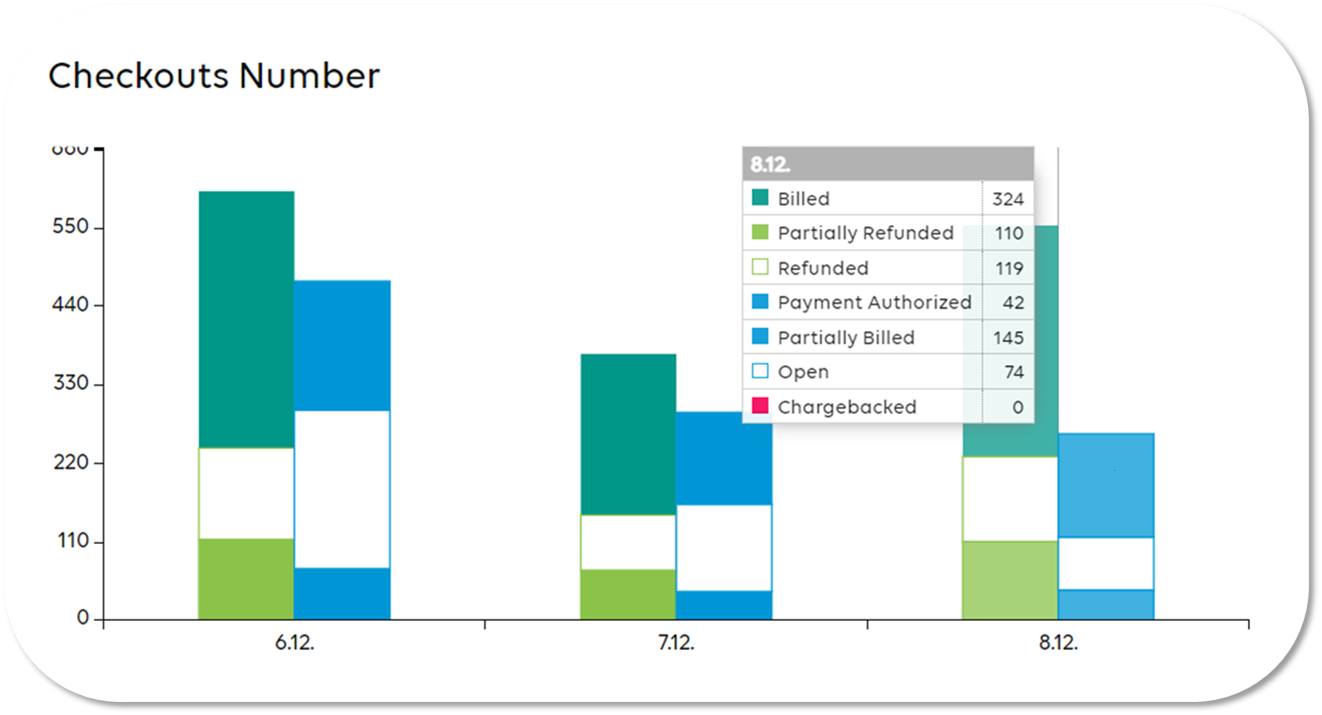
The "Checkouts Number" dashboard widget provides an overview of the total number of checkouts per status for the selected time period. The data is clustered in the same way and uses the same numbers as widget "Checkouts Overview".
Depending on the selected time period, the visual timeline changes:
|
Days |
Unit |
Format |
Example |
|---|---|---|---|
|
1 – 30 |
Day |
dd.mm. |
02.10. |
|
31 – 210 |
Calendar Week |
CW w |
CW 40 |
|
211 – 999 |
Month |
mm/yyyy |
10/2023 |
|
1000 – 2499 |
Quarter |
Qq/yyyy |
Q4/2023 |
|
2500+ |
Year |
yyyy |
2023 |
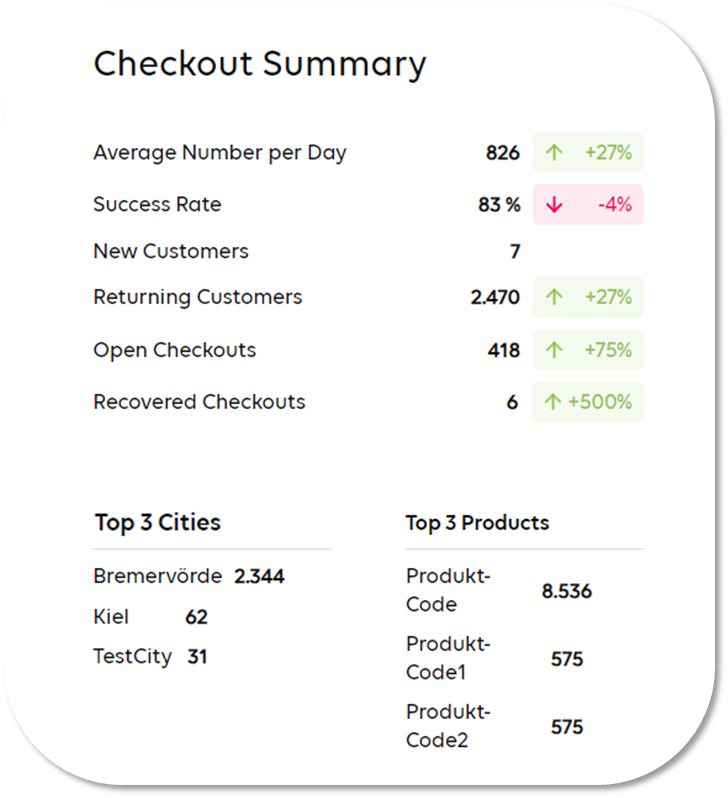
Checkout Summary
|
Checkout Summary - Explanation of KPIs |
|
|---|---|
| KPI | Explanation |
| Average Number of Checkouts per Day |
Shows the average number of checkouts per day for the selected period. |
| Success Rate |
The KPI includes all that have a successful payment authorization. Example: for a selected time period there is a total number of 2400 checkouts of which 2000 are in the status COMPLETED, BILLED, and CHARGEBACKED. The success rate would be 83%. For the previous time period the success rate was 87%. Therefore the portal would display a change of 4% (interpreted as percent points). |
| New Customers |
The current logic to define and calculate new customers is done in such a way that the backend searches for Checkouts that have been created in the requested time period and have a unique merchantCustomerId. If a merchantCustomerId is found more than once, the customer is only not counted as a Returning Customer. In future, the payment method will also be included in the query. For this, the tokenization of the payment method will be used. Example: a card token will be used to determine whether a card has already been used either in e-commerce or at the POS for the requested time period |
| Returning Customers |
Returning Customers are defined as shoppers that already have done one sale in the requested time period and are calculated by searching for merchantCustomerId from the Checkouts and if they are found more than once. If a merchantCustomerId is found more than once, the customer is counted as a Returning Customer. In future, the payment method will also be included in the query. For this, the tokenization of the payment method will be used. |
| Open Checkouts |
The number of Open Checkouts represents all Checkouts of the requested time period that have the status OPEN or PENDING_COMPLETION. For further explanations regarding the Checkout Status: Commerce Portal - Checkout Status Modell. |
| Recovered Checkouts |
The number of Recovered Checkouts is calculated by checking the payment events of a checkout. The query checks whether there are Checkouts for the requested time period in which at least one payment has failed as well as one successful payment is identified. Important Remark
Currently, the calculation can only be done for payment executions (i.e. only e-commerce). Recovered Checkouts with payment information are not taken into account since POS transactions have a different structure and failed and successful events are not provided within the same business transaction. Further definition of Payment Execution and Payment Information: CommerceCase & Checkout |
| Top 3 Cities |
For the calculation of the top 3 cities, all cities of the Checkouts for the requested time period are retrieved and checked by shippingAddress. The cities with the most results are sorted in descending order. |
| Top 3 Products |
For the calculation of the top 3 products, the productCode of the respective items of the shoppingCart of the Checkouts for the requested time period are taken into account. The products with the most results are sorted in descending order. |
Sales Channels
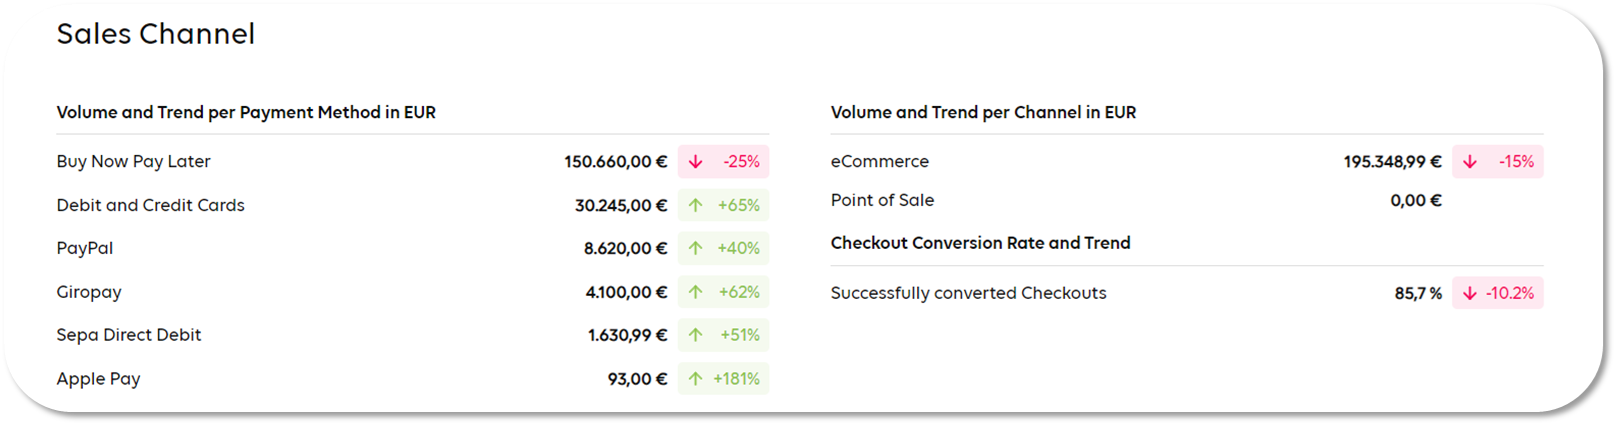
The "Sales Channels" dashboard widget gives an overview of the volume per payment method as well as per channel. In addition, it also indicates the conversion rate of checkouts. In addition to the numbers of the selected time period, there is also a trend displayed which indicates an increase or a decrease (in percent) compared to the identical number of days for the previous time period.
Important Remark
If no trend is indicated this means that the number of the previous time period was "0". Since it is mathematically incorrect to divide with "0", there is no trend displayed.
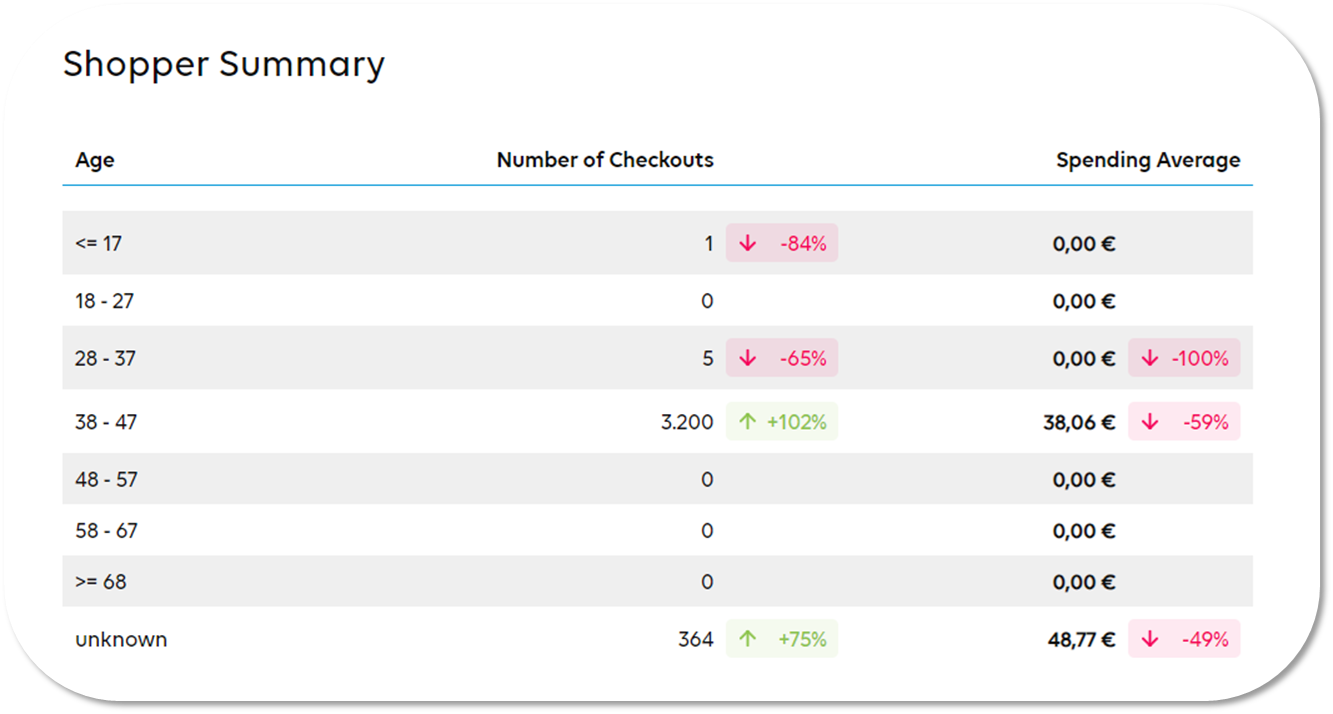
Shopper Summary
| Shopper Summary - Explanation of KPIs | |
|---|---|
| KPI | Explanation |
| Age Group |
The age group will be provided in the request from the frontend as search query parameter and groups are clustered in the backend to retrieve the requested data. The Age can be retrieved from the parameter dateOfBirth (customer object). The age group is the primary key for the other two metrics is calculated in the format YYYYMMDD as integer and is rounded up. Example: a customer person with dateOfBirth 10.05.2000 is already 23 years old on 01.03.2023. |
| Number of Checkouts |
The number of checkouts provides the total number of checkouts for the requested time period per age group. For the calculation of the trend, the total number of checkouts for the same number of days in the past is also returned. Every checkout status is considered in the calculation. For further explanations regarding the Checkout Status: Commerce Portal - Checkout Status Modell. |
| Average Spending Amount |
The average spending metric returns the average collected amount of all checkouts that were created in the requested time period. For the calculation of the trend, the average spending for the same number of days in the past is also returned. Important Remark The widget only takes in consideration the collectedAmount (i.e. amounts that have been captured and collected). |
| Number of Checkouts per Age Group and Payment Method (Fly-out) |
The first fly-out will return the number of checkouts per and payment method in descending order for the respective age group for the selected time period. Important Remark Only checkouts with a successful payment and a collected amount of payments are displayed. |
| Average spending Amount per Age Group and Payment method (Fly-out) |
The second fly-our returns the average collected amount and payment methods in descending order for the respective age group for the selected time period. Important Remark The average spending amount is calculated by adding up Checkouts with a successful payment and calculating the average collectedAmount (i.e. amounts that have been captured). |